
Introduction
Cleaning and processing the original Seasat telemetry data presented challenges ranging from bit rot and data discontinuities to conflicting time records. Each step involved writing new software. When the telemetry data filtering was finished in the spring of 2013, 1,346 raw Seasat swaths were ready to be processed into synthetic aperture radar (SAR) image products. Engineers then turned their attention to the processing itself, and released beta products to commemorate the 35th anniversary of Seasat’s launch.
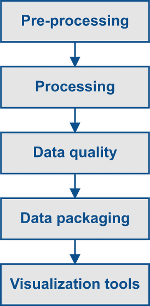
The following pages give an overview of the raw data preparation or pre-processing, image processing and product packaging. It is important to note that several data quality issues do exist in the resulting products — including imprecise geolocations and some image anomalies. There are some visualization tools that work with ASF’s Seasat HDF5 products.
Pre-processing
Seasat data were originally archived on 39-track raw data tapes. Years later, to ensure the preservation of the data, those tapes were duplicated in 1988 and again in 1999. During the second transcription, the raw telemetry data were transferred onto 29 more modern SONY SD1-1300L 19 mm tapes. Due to the transition of data through a number of different medias, special attention has been spent on cleaning the data during pre-processing.
In a first step, Seasat telemetry data were captured from the 19 mm tapes and byte-aligned using Vexcel’s SyncPrep tool. The raw telemetry data were then decoded into a format that a SAR processor could handle.
The decoded data was analyzed to get a first sense for the quality of the data. Pervasive bit errors, data drop outs, partial lines, discontinuities, and other irregularities were still present in the decoded data.
The many errors present in the Seasat raw data required multiple levels of cleaning and filtering before the actual SAR processing could be carried out. The time values needed special attention in this respect, since any further processing could not occur without this filtering step.
Median filtering was applied to metadata fields such as station code, least significant digit of year, day of year, clock drift, bits per sample, PRF rate code and delay to digitization. Linear regression was used to clean up the milliseconds of day metadata field. The linear regression needed to be refined in various ways. The measures to improve its robustness include restricting the time slope, removing bit errors from times, removing stair steps from times and removing time discontinuities.
Various time slope correction settings were used for the filtering and evaluated on a case-by-case basis. With another final level of filtering to fix bad start times, even more data was recovered. An example for cleaning a raw data set, as well as statistics on the amount of Seasat data recovered from tape and cleaned using these techniques, is given in the description of the Prep_Raw.sh cleaning script.
Several categories of bad data were identified during the analysis of the decoded and cleaned raw data: short files, constant time, random time, every other zero, time gap, time slope and wrong fix. Ultimately, this reduced the total amount of original Seasat data that could be processed to imagery by only a small fraction.
Processing
After the Seasat telemetry data was byte-aligned, decoded and cleaned, the raw data was ready to be processed into images. The Jet Propulsion Laboratory’s (JPL) repeat orbit interferometry (ROI) package was chosen to process the offset-video-format-encoded Seasat raw data. However, modifications were made to the processing system to improve the Seasat processing results.
ASF engineers evaluated the available sources for state vectors and chose the one that resulted in the best geolocation in the final products.
The Doppler value, a key parameter in describing the viewing geometry of the SAR sensor, is one of the most critical pieces of information for processing a data set into a focused image. Special attention is paid to the data quality analysis in order to detect ambiguities in the Doppler estimation. Ultimately, a visual inspection of each product determines if re-processing an image with a different Doppler value improves the focus of an image.
Range spectra filtering is applied to remove radio frequency interference. The delay to digitization — the time delay between transmitting and receiving a pulsed SAR signal — is adjusted on a regular basis. The required shifts are stored in a data window position file passed to ROI for processing.
The processing of the swath files into data products is carried out with the ASF Seasat Processing System (ASPS). ASPS uses the modified version of ROI to generate single look complex (SLC) images that are converted with ASF tools to the final detected ground range HDF5 products. The naming convention of the products follows
SS_ooooo_STD_Fffff,
where ooooo is the five digit orbit number of the Seasat satellite at the time of imaging and ffff is the four digit ESA frame number scheme, modified to create images 100 km x 100 km in size.
Data Quality
After pre-processing and processing of the data, there are remaining data quality issues to be aware of in the imagery. These anomalies result from sensor issues and processing limitations. All Seasat products can be searched and downloaded from ASF’s Vertex data portal.
Sensor anomalies are prevalent in Seasat data. One example is a calibration pulse that was introduced into the raw data in order to perform system testing. As a result, the majority of the Seasat imagery processed contains a very visible calibration pulse. Techniques for attempting to remove this calibration pulse from the data are currently under investigation. Another signal embedded into the raw data creates a set of short lines across the range direction. Attenuation, the gradual loss of image brightness across the image, appears in images from the first part of the Seasat mission, and it is possible that this effect may not be able to be removed from the data.
Image anomalies in the data are often introduced during acquisition or processing such as banding — a common result of missing data —, streaks in the along-track direction and streaks in the across-track direction. For Seasat data, the techniques for cleaning the raw data might have introduced additional artifacts. For example, only data with less than 4.5 percent partial lines actually focuses into valid imagery. Existing data gaps have been annotated in the metadata. When unfocused images are encountered during visual analysis, ASF re-processes the Seasat product with an adjusted Doppler value.
All available Seasat state vectors provide orbital information with an accuracy of several kilometers. Offsets were observed and have been mitigated by introducing an empirically determined slant shift of -1000 m. This shift resulted in geolocation errors in most cases on the order of 1 km or less. The introduced slant shift is going to be further investigated after more data sets are processed. Users are strongly advised to carefully evaluate the geolocation of individual data sets and should not expect that the geolocation accuracy is readily comparable to more recent SAR missions.
Finally, the data products can currently not be used for any quantitative analysis, since the ROI processor is not calibrated for Seasat data.
Data Packaging
The Seasat data product packages are distributed in two different formats: HDF5 and GeoTIFF. The files that are common to both packages, provided in the compressed .zip format, are the following:
- Browse image: SS_ooooo_STD_Fffff .jpg
- ISO XML metadata: SS_ooooo_STD_Fffff.iso.xml
- XML metadata: SS_ooooo_STD_Fffff.xml
- KML coverage file: SS_ooooo_STD_Fffff.kml
- Data quality report: SS_ooooo_STD_Fffff.qc_report
The Seasat HDF5 products contain two groups: data and metadata. The data group contains the SAR data as backscatter values and geographic coordinates. The structure within the metadata group was modeled after the TerraSAR-X metadata (Astrium, 2013). The ASF Seasat HDF5 products have the file extension .h5.
The GeoTIFF data products are geocoded to the Universal Transverse Mercator (UTM) map projection. The original 12.5 m pixel size and the floating-point values of the ground range HDF5 products are kept in the GeoTIFF format. Because this product type does not require additional geographic information, it only contains a single layer of SAR data and is, therefore, considerably smaller than the HDF5 product. The ASF Seasat GeoTIFF products have the file extension .tif.
Users are advised that the Seasat products, whether in HDF5 or GeoTIFF format, may have substantial geolocation errors.
Visualization Tools
The Seasat HDF5 products are currently supported to varying degrees by a number of software packages that can be used to investigate and visualize the data.
The Geospatial Data Abstraction Library (GDAL) helps explore the general contents of the Seasat HDF5 data. The gdalinfo tool summarizes the data structure in the file. The gdal_translate tool can extract the SAR data out of the structure and store it into a more versatile GeoTIFF.
The commercial geographic information system ArcGIS recognizes the HDF5 structure and is able to extract the SAR data on the fly. The program does not calculate standard statistics for this data layer and is very slow in rendering the data this way. The handling of the data can be significantly improved by converting the HDF5 data layer HH into a GeoTIFF file using the gdal_translate tool.
The standard viewer of the MapReady tool suite offers the most comprehensive support for Seasat HDF5 data. It does not have any limitations for file size and provides the full functionality of asf_view, including sub-setting areas of particular interest.
HDFView, provided by the HDF group, has two different ways to look at the data. For any quantitative analysis, the selected data layer needs to be opened as a spreadsheet. For a more visual analysis, HDFView provides the image view. The program has no options for stretching the data in a statistical fashion. However, the user can manually change the brightness and contrast.
Panoply, developed by NASA’s Goddard Institute for Space Studies, is primarily used for global data sets of lower resolution, and visualizing Seasat HDF5 with it is difficult. The rendering at 12.5 m pixel size requires working with a subset of the Seasat HDF5 product.
The Interactive Data Language (IDL) provides a more programmatic means to visualize the Seasat HDF5 data. The IDL H5 browser has very limited functionality in terms of changing visual value ranges and stretching the imagery for visualization purposes but does provide users the ability to view the HDF5 products.
