Alaska Satellite Facility - Distributed Active Archive Center

Seasat – Technical Challenges – 10. Quality Issues

After the decoding, cleaning and focusing of the Seasat synthetic aperture radar (SAR) data, many artifacts still exist in the initial ASF Seasat SAR products. Most of the artifacts observed in the images result from system interferences during data acquisition, missing data as a result of multiple transcriptions between media storage since 1978, and processing decisions implemented in the ASF Seasat Processing System. ASF’s intent is to distribute as much of the historic dataset as possible to our users while offering transparency about known quality issues.

These anomalies can be split into those known to be caused by the sensor and those that are visible in the imagery but not tied to a specific cause.

10.1 Sensor Anomalies

Some anomalies in the ASF Seasat products have a known cause, originating in some fashion from the platform itself. Sections of no valid data occurring at the beginning and end of many swaths result in frames with missing imagery. A calibration pulse embedded into some of the signal data appears as a bright line in the center of focused frames. An additional calibration signal manifests as a pattern of dashed lines. Finally, some images show extreme attenuation due to incorrect sensor parameters.

10.1.1 No Data

During processing, several swaths showed no data at all. Most likely the satellite was in a test mode during these times. These products were discarded. However, many of the original swaths start with no data being collected, introduce real data after some number of lines and end the datatake with another patch of no data collection. This means that swaths contain both invalid and valid data. Since the bit fields that may have given information on whether the satellite was actually imaging were unreliable, ASF chose to process all of the data in each swath.

Then, during the Quality Control (QC) process, products that contained less than 50 percent valid SAR data were discarded. Products that contained more than 50 percent were kept and made available in the ASF data pool. Thus, some of the ASF Seasat products contain areas of no valid SAR data, which are easily identified by blackness resulting from having no data to focus during processing. 

No Data Examples
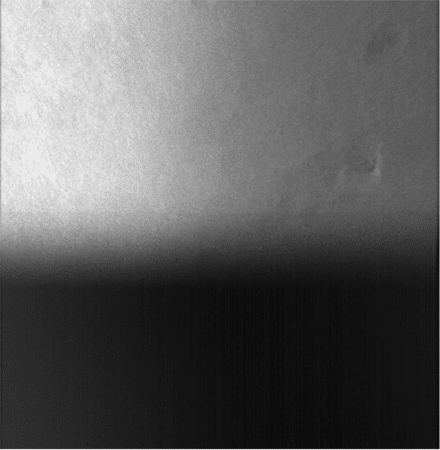
No Data: The bottom half of this scene holds no valid SAR data. It was decided that any scene with more than 50 percent valid data would be saved and published.
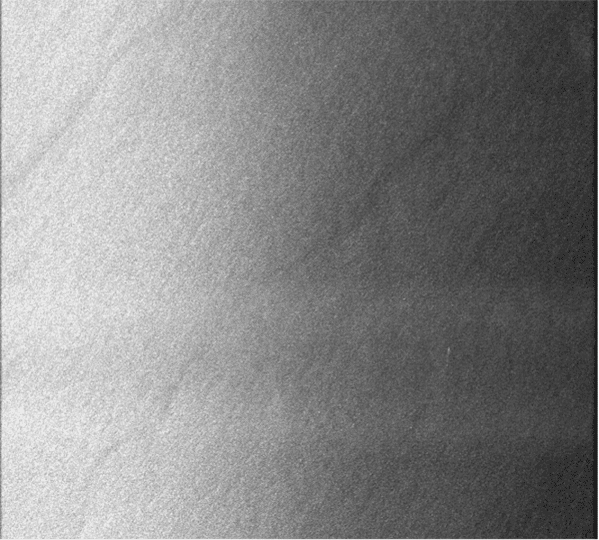
No Data: This scene ran out of valid data right at the end of focusing. Note how the brightness fades as each successive line has less and less valid data to focus.
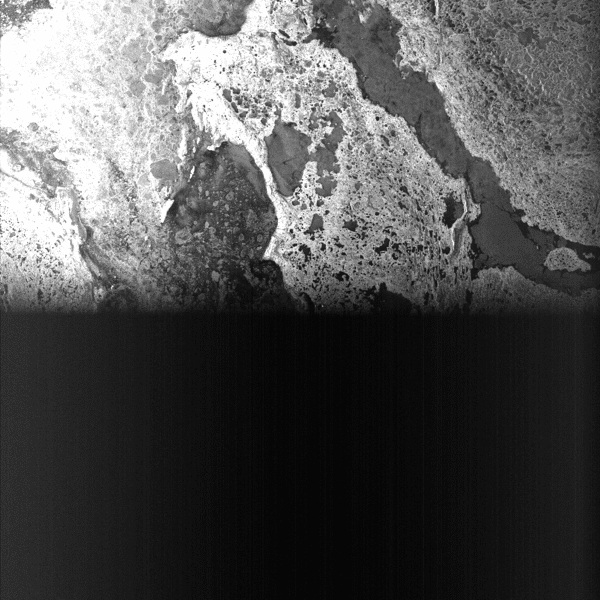
No Data: This image has no valid SAR data in the bottom half.

10.1.2 Calibration Pulse

During the start of the Seasat mission, when engineers were still testing system parameters, a calibration pulse was introduced into the raw signal data. Unfortunately, because the mission was cut so short by a power failure, much of the Seasat data has an embedded calibration pulse.

This pulse, when focused, forms a bright white line in the azimuth direction, somewhere near the middle of the swath. 

Initial investigations into the calibration pulse show that it can be removed algorithmically. It is ASF’s intention to remove the pulse in future releases of Seasat SAR products.

Calibration Pulse Examples
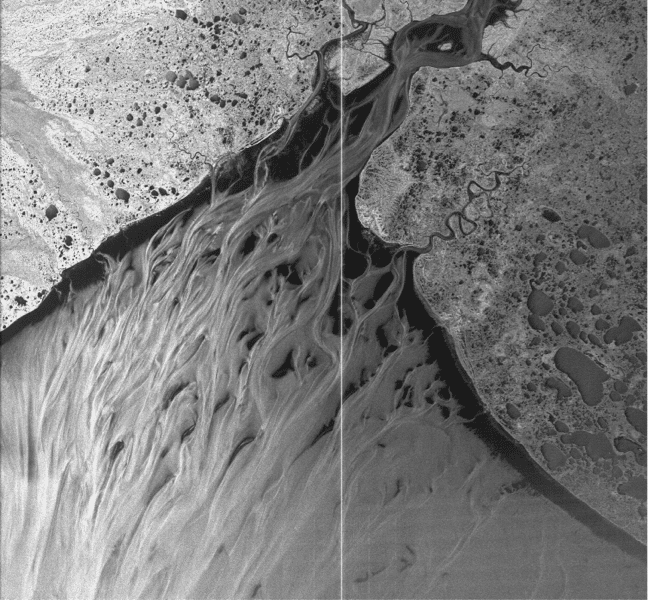
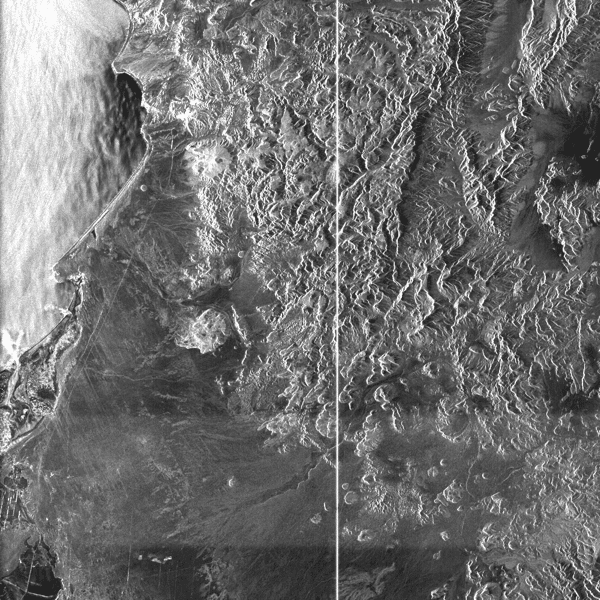
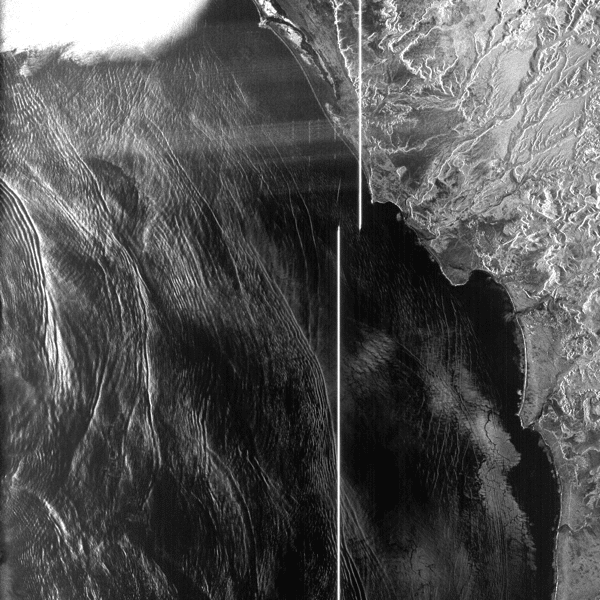
Calibration Pulse: Kuskokwim Delta, Alaska — This image shows the effects of the calibration pulse — a white line in the azimuth direction near the middle range of the image. Also visible is banding near the bottom of the image.
Calibration Pulse: This image again shows the calibration pulse line near the middle of the image. Also readily visible is the effect of a data window position shift on the calibration pulse’s location in the image.

10.1.3 Dashes

Another signal was embedded into the Seasat raw data. This one creates a set of short lines across the range direction of an image when focused. It has been verified that this signal is a real occurrence in the raw data. It is not known what the origin or intent of this signal was. It is noted that whenever this signal is present in the data, the calibration pulse is not.

Although often the calibration pulse precedes and follows a section of dashes in an image, it also appears in data that has no calibration pulse. It is unclear if this signal can be removed from the raw data in a future release of ASF Seasat products, but that step will be examined for feasibility.

Dashes Examples
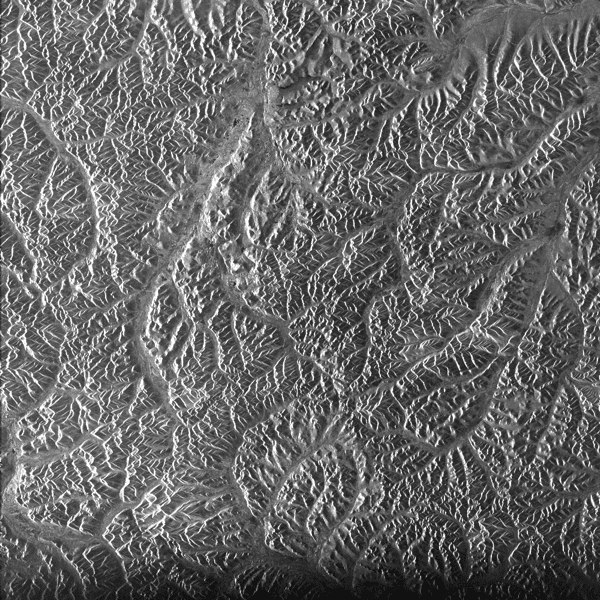
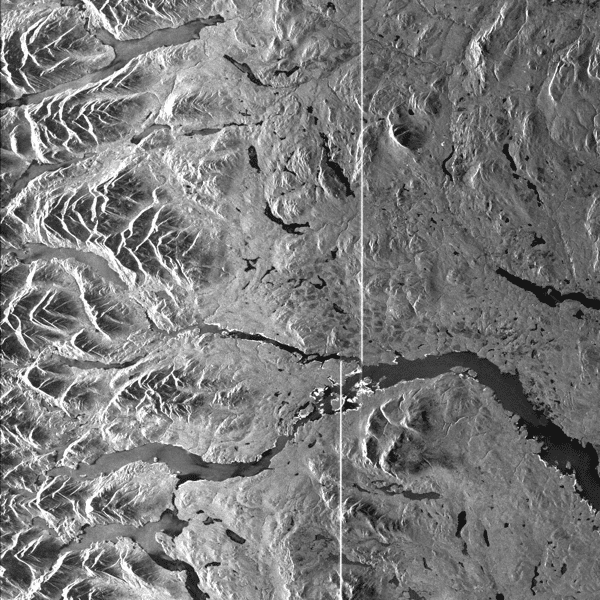
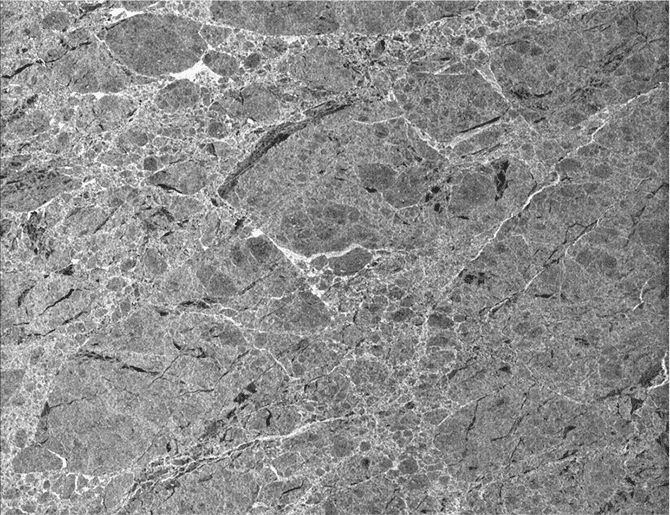
Dashes: A distinctive pattern of lines occurs regularly in focused Seasat data.
Dashes: The dash pattern across this image occurs in several Seasat images. It is noted that the whenever the dashes occur, the calibration pulse stops. This indicates that the dashes were intentionally placed into the signal data by Seasat engineers.

10.1.4 Attenuation

Some of the ASF Seasat products have extreme across-track attenuation. The effect is that the near range of the image is very bright, while the far range is quite dark. It was initially thought this had to do with the gain control on the satellite (which was one of those unreliable bit fields). However Jet Propulsion Lab (JPL) engineers indicate that it is possible this was caused by incorrect delay-to-digitization settings during the first part of the Seasat mission. In any case, this effect probably can never be removed from the imagery, only noted as a data quality issue.

Attenuation Examples
Extreme Attenuation
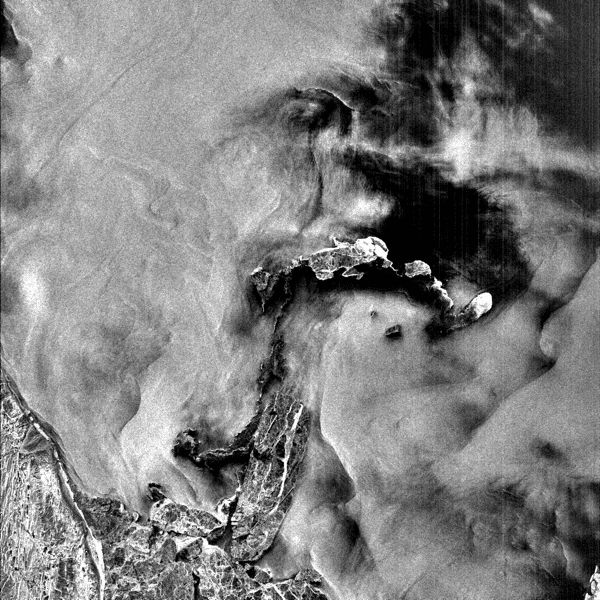
Extreme Attenuation: This image shows the extreme attenuation present in some of the Seasat imagery. It is understood that this resulted from an incorrect parameter setting.
Not Extreme Attenuation
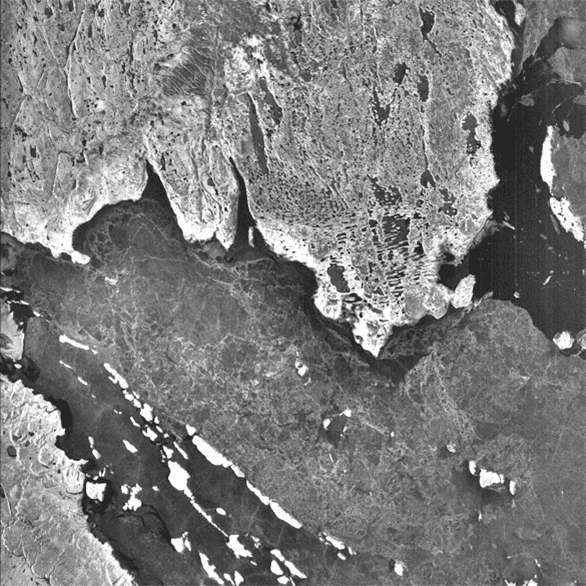
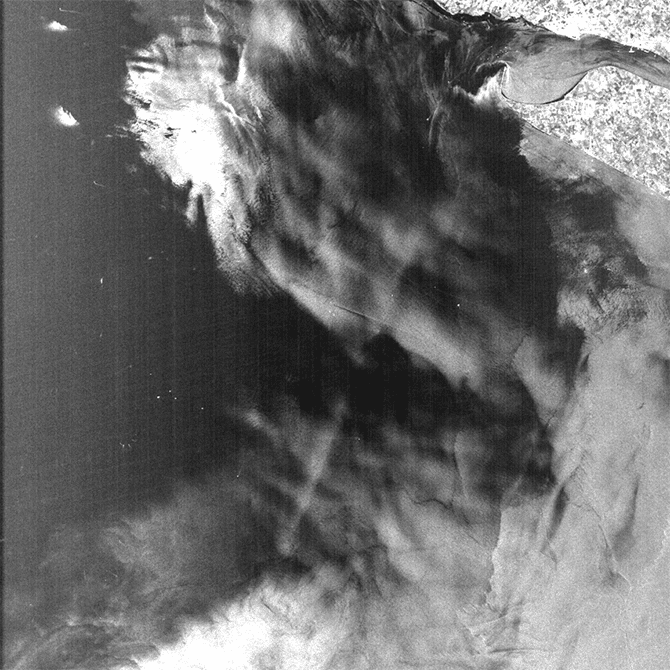
Not Extreme Attenuation: For comparison purposes, here is another Seasat image that shows similar content (sea ice) but does not display the extreme across-track attenuation.

10.2 Image Anomalies

It is commonly known that SAR imagery often has data anomalies, arising during image acquisition or processing, that visually impact focused products. These can be the result of atmospheric effects or of missing data. It is possible they are effects from the data cleaning not being done properly. In time, the causes for many of these anomalies may be determined and addressed; however, ASF has not yet completed a full analysis. Still, the following anomalies were noticed and annotated during the visual QC process.

10.2.1 Banding

Banding across SAR imagery is a fairly common occurrence and can be the result of atmospheric effects or poor data. Some banding was noticed in the ASF Seasat products. 

Banding Examples
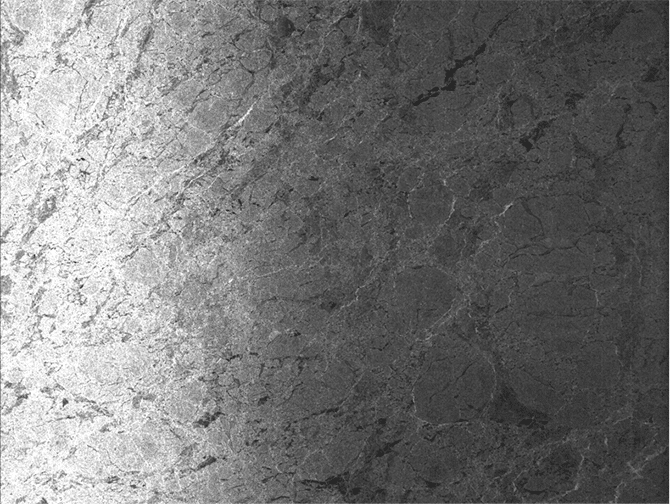
Across-Track Banding: Often very subtle, across-track banding like that visible in this image occurs in some of the Seasat SAR products created at ASF.
Across-Track Banding: In this example, only a single band is present across the bottom of the image, but it is quite bright.
Non-regular Banding: It is common for across-track banding to show some curvature, as is displayed across the top of this image. This is due to the range migration portion of SAR focusing.

10.2.2 Along-Track Streaks

Much, if not all, of the Seasat imagery shows some amount of along-track streaking. Although ASF removed some of these streaks using the range spectra filtering, some remain.

Along-Track Streaks Examples
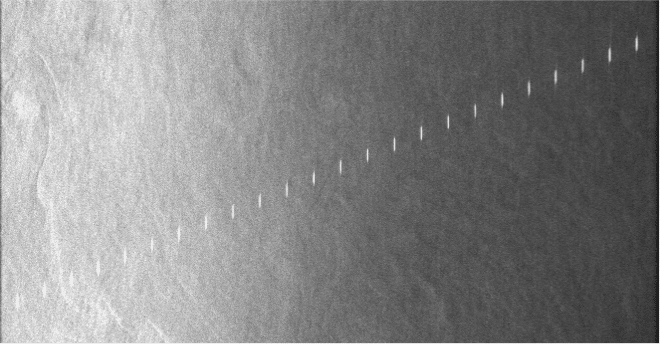
Along-Track Streaks: In spite of the spectral filtering applied, some Seasat imagery still displays along-track streaks. Since these occur in much of the imagery, they are most likely due to systematic sensor or data collection errors. The cause is being investigated.
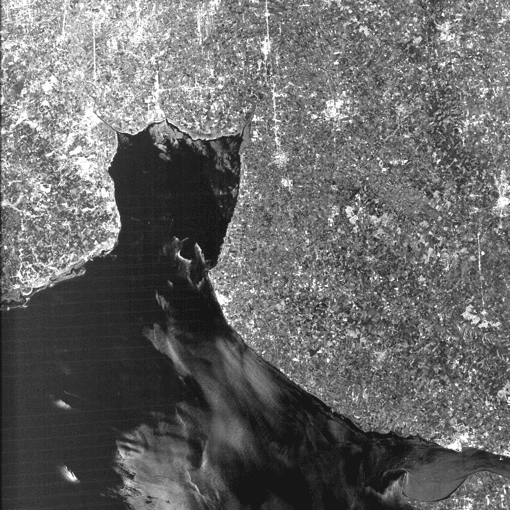
Hidden Streaks: Often along-track streaking is hidden by brighter returns in the imagery. However, when dark areas occur, especially in the far range, along streaks become obvious.

10.2.3 Across-Track Streaks

In addition to the along-track streaks, across-track streaks also occur. Typically these are lines across the imagery, often bent in one direction or another. This bending results from the range migration portion of the SAR focusing algorithm.

Across-Track Streaks Examples
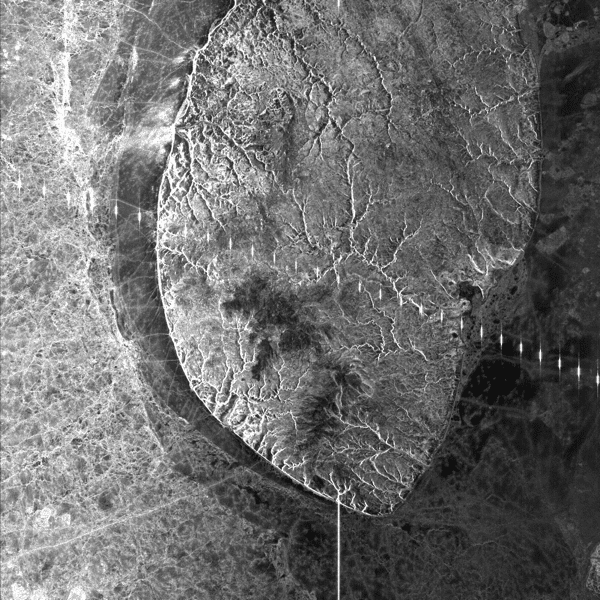
Across-Track Streaks: Across-track streaking is readily obvious in this scene.
Along-Track and Across-Track Streaks: Some imagery evidences multiple data quality anomalies, like this image with both across-track and along-track streaks.

10.3 Missing and Partial Lines

When the Seasat data was first decoded, over half of the datasets showed time gaps. In the end, missing lines were filled with random values in 494 out of 1,346 swath files. Although the worst saved file had 136 gaps filled, only 34 files had 10 or more gaps, while 288 files had only one or two gaps in them.

To ensure users are fully aware of data anomalies that may cause analysis issues, any missing lines that occur within the raw data used to focus a product are annotated in the XML metadata files provided with the products.

Data Gap Information in XML: Each time a data gap occurs in the raw data used to create an ASF Seasat product, it is annotated inside the XML metadata file.

In addition to missing lines, partial lines occurred regularly during the Seasat decoding. In fact, some number of partial lines were found in 1,170 of the 1,346 cleaned swath files processed at ASF. The worst files had up to 42 percent partial lines. However, those files did not process correctly. Only files with less than 4.5 percent partial lines focused into imagery. Only 32 of the cleaned swath files that ASF processed into products had more than 1 percent partial lines. 

Several of the swaths with the worst partial lines were processed and examined visually for effects; none were noticed. It was noticed that in most cases the majority of partial lines occurred near the start of the first product in a swath. This makes sense, as SyncPrep broke raw signal files into pieces when the data was first byte-aligned. SyncPrep breaks the files only if it loses sync, i.e. if a bad section of data is encountered. It is no wonder then that the start of many of these swath files have some amount of partial data in them.

Because of the lack of visual effects from the partial lines and the small number of files affected by any large amount of partial data, this information was not annotated in the metadata files. It is possible that in future releases this information may be made available in the product metadata if it is requested.

10.4 Missing and Partial Lines

In the beta release of ASF Seasat products, no advanced geolocation corrections were applied. However, a few modifications were made during development that have brought the observed geolocation errors to within 1 kilometer in most cases.

ASF compared state vectors derived from Two Line Element files at CelesTrak with the Seasat precise orbits solutions made as part of the NASA Ocean Altimeter Pathfinder Project. It was determined that the precise orbit solutions gave better geolocations in final products and were, therefore, used in the production of the Seasat detected image archives.

Satellite imaging times were filtered as accurately as possible. First, a crude time filtering was applied to fix gross errors greater than 513 from the local trend line. Next, sticking satellite clock times were brought into line, and a final linear fit was performed to bring all time values to within 2 msec of the new linear trend. Then, all discontinuities in the time fields of the data were found and fixed. Finally, the start times of all files were changed to match the linear trend of the rest of the file.

Although ASF has not undertaken a thorough analysis of geolocation accuracies, it was noted that Seasat geolocations usually show an across-track error. To adjust for this, a negative 1,000-meter slant range shift was introduced into the products when calculating georeferencing information. Users are advised that when attempting to recreate the geolocations stored in either the HDF5 or the GeoTIFF products, this -1,000-meter slant range shift must be taken into account.

In the end, the data quality group at ASF examined only six different sites for geolocation accuracy. Each image’s geolocations were matched against the same feature in an Advanced Land Observing Satellite (ALOS) Phased Array L-band Synthetic Aperture Radar (PALSAR) image. This removed any concern over geolocation shifts dues to terrain height; i.e., the terrain height would affect both the Seasat and the ALOS images similarly, meaning the effect would be cancelled out.

Site Location Observed Geolocation Offset
Albany, OR 1300.7
Big Delta, AK 908.8
Datchet, England 812.5
Dallas, TX 1611.8
Milton, LA 351.9
Apalachicola, Florida 152.1

Geolocation Analysis: The ASF data quality group, comparing locations in the Seasat images with locations in ALOS PALSAR imagery, examined six sites. Offsets are given in meters.

Written by Tom Logan, July 2013