

| Bit Errors |
|---|
| It is assumed that the vast majority of the problems in the original data are due to bit errors resulting from the long dormancy of the raw data on magnetic tapes. The plots in section 2.1 showed typical examples of the extreme problems introduced by these errors, as do the following time plots. |
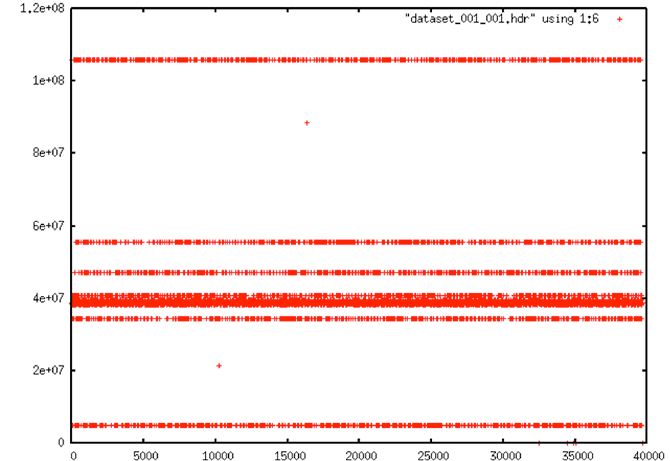 |
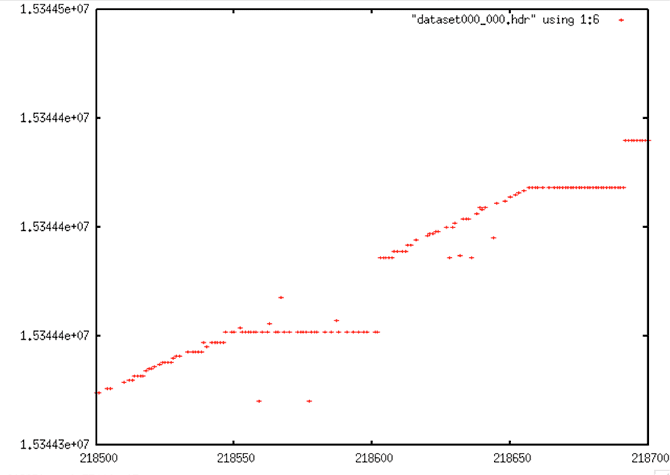
| Time Plot: Very regular errors occur in much of the data, almost certainly some of which are due strictly to bit errors. Note that this plot should show a slope, but the many errors make it look flat instead. |
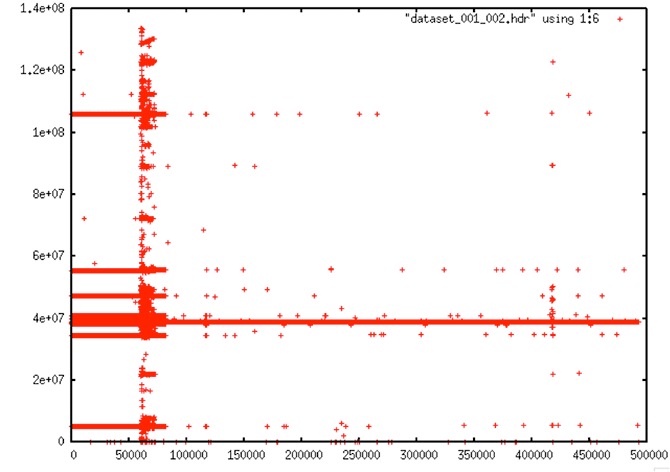 |
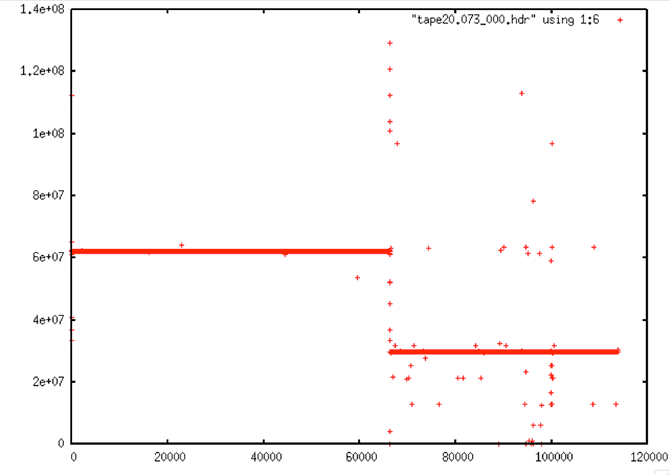
| Time Plot: This plot shows a typical occurrence in the Seasat raw data: Some areas of the data are completely fraught with random errors; other areas are fairly “calm” in comparison. |
| Systematic Errors in Timing |
|---|
| Box errors |
 |
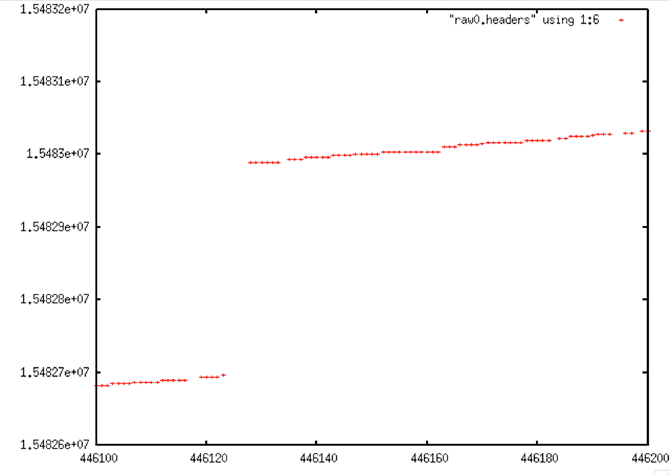
| Stair Steps |
 |
| Data Dropouts |
 |
| Forward Time Discontinuity |
 |
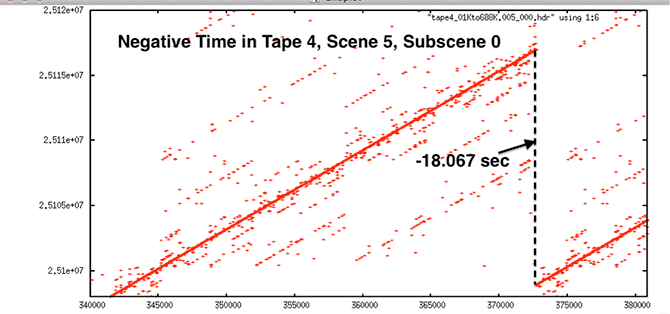
| Backward Time Discontinuity |
 |
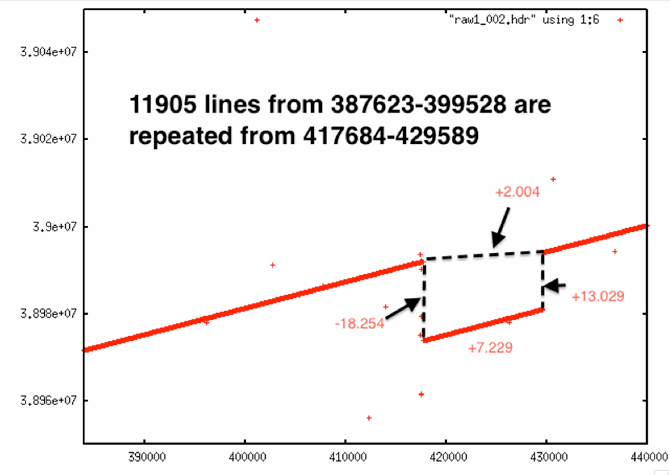
| Double Discontinuity |
 |
| Time Discontinuity |
 |
